- Smarter with AI
- Posts
- MonDive#30: From Raw Notes to Polished Visual Content
MonDive#30: From Raw Notes to Polished Visual Content
Using Google NotebookLM to turn notes into infographics, slides, mind maps, and videos

Welcome to the MonDive
Today in MonDive, we’re diving into NotebookLM, Google’s AI-powered research tool built to turn notes, documents, and sources into clear, structured outputs.
To demonstrate its capabilities, we used a single set of notes to create infographics, slide decks, mind maps, interactive boards, and explainer videos.
Alright, let’s dive into exploring what you can build with NotebookLM.
This LIVE 3-Hour Masterclass Could Save You 30+ Hours a Week.
Sponsored
Imagine having AI experts running your calendar, inbox, socials, and documents — all at once, all on autopilot.
On Tuesday, 20th January at 9AM join a select group of innovators who are redefining how work gets done with AI.
In this 3-hour AI Agent Mastery Session, we’ll show you step-by-step how to design, deploy, and automate AI systems that run entire workflows without you lifting a finger.
Whether it’s managing projects, handling customers, generating content, or analyzing data, these agents will work across every platform you use.
No code. No tech jargon. Just a proven blueprint for turning your ideas into powerful AI-driven results — faster than you ever thought possible.
🧠 Why This Matters
Unlike chat-based AI tools that generate answers in isolation, NotebookLM works directly with your own notes, documents, and sources.
Most people don’t struggle to get information they struggle to organize it, understand it, and reuse it. Research lives in one place, slides in another, visuals somewhere else, and nothing stays connected.
NotebookLM brings everything together. It lets you take one set of notes and turn it into infographics, slide decks, mind maps, and videos all from a single workspace.
It’s like having a personal research assistant that doesn’t forget context and doesn’t hallucinate.
To show how practical this is, we’ll take a simple set of notes and turn them into multiple high quality outputs using NotebookLM.
Getting Started With NotebookLM
Create Visual Infographics From Your Notes
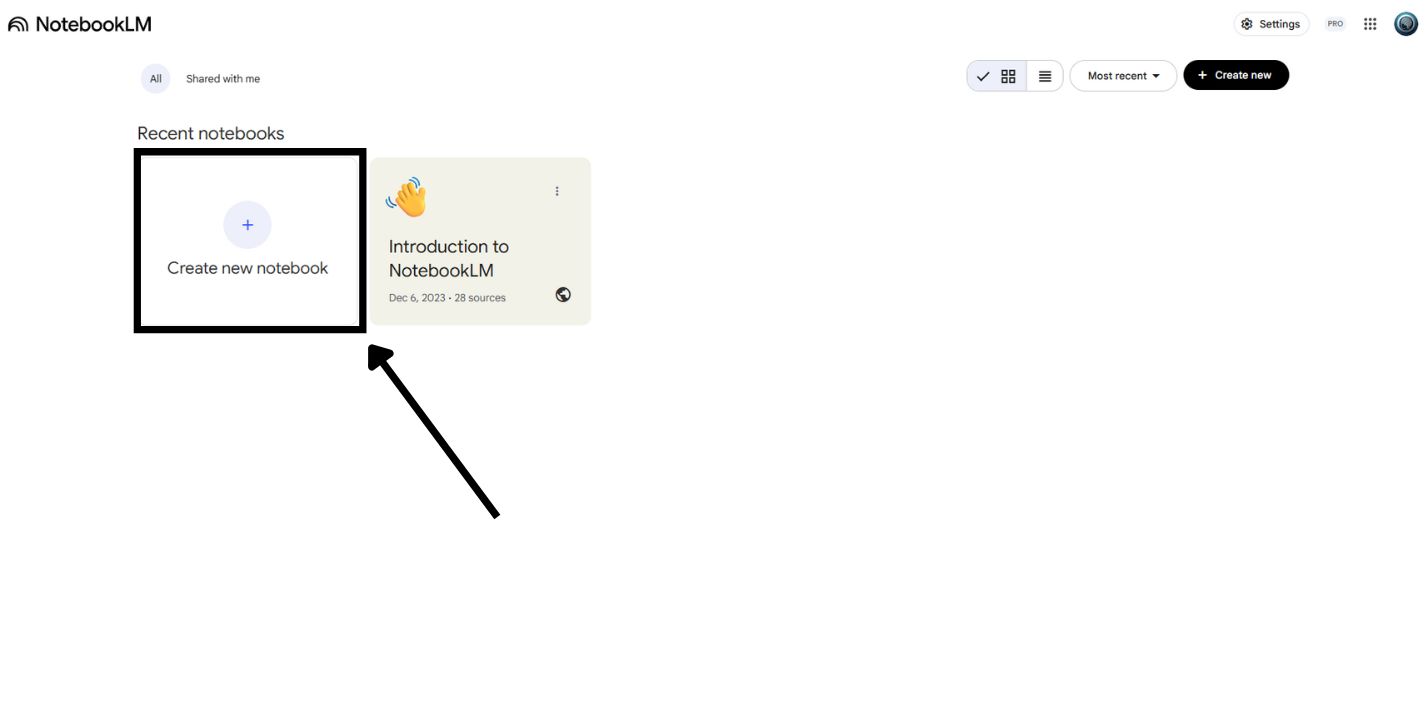
On the home screen, click Create new notebook
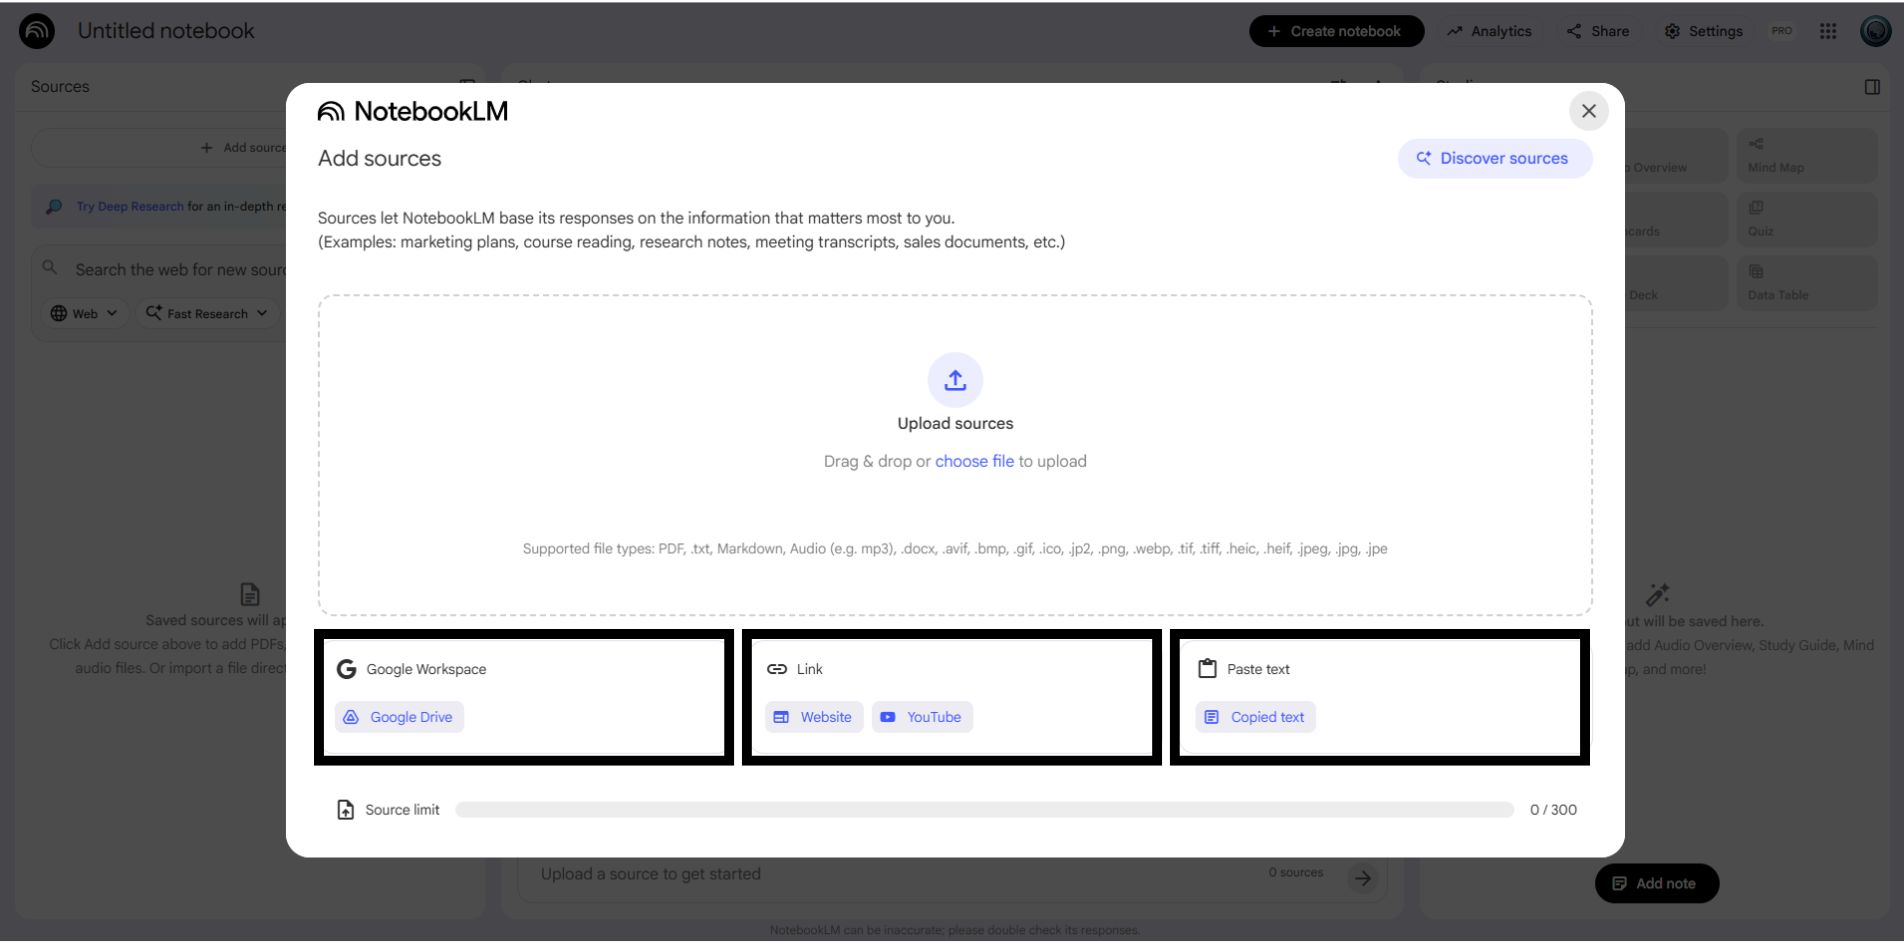
Once inside your notebook, make sure you’ve added content — this can be:
pasted notes
research
blog posts
documents
or any written material you want to visualize
Now look to the right-hand panel and click Infographic.To improve the output, click the pencil icon next to the infographic option.
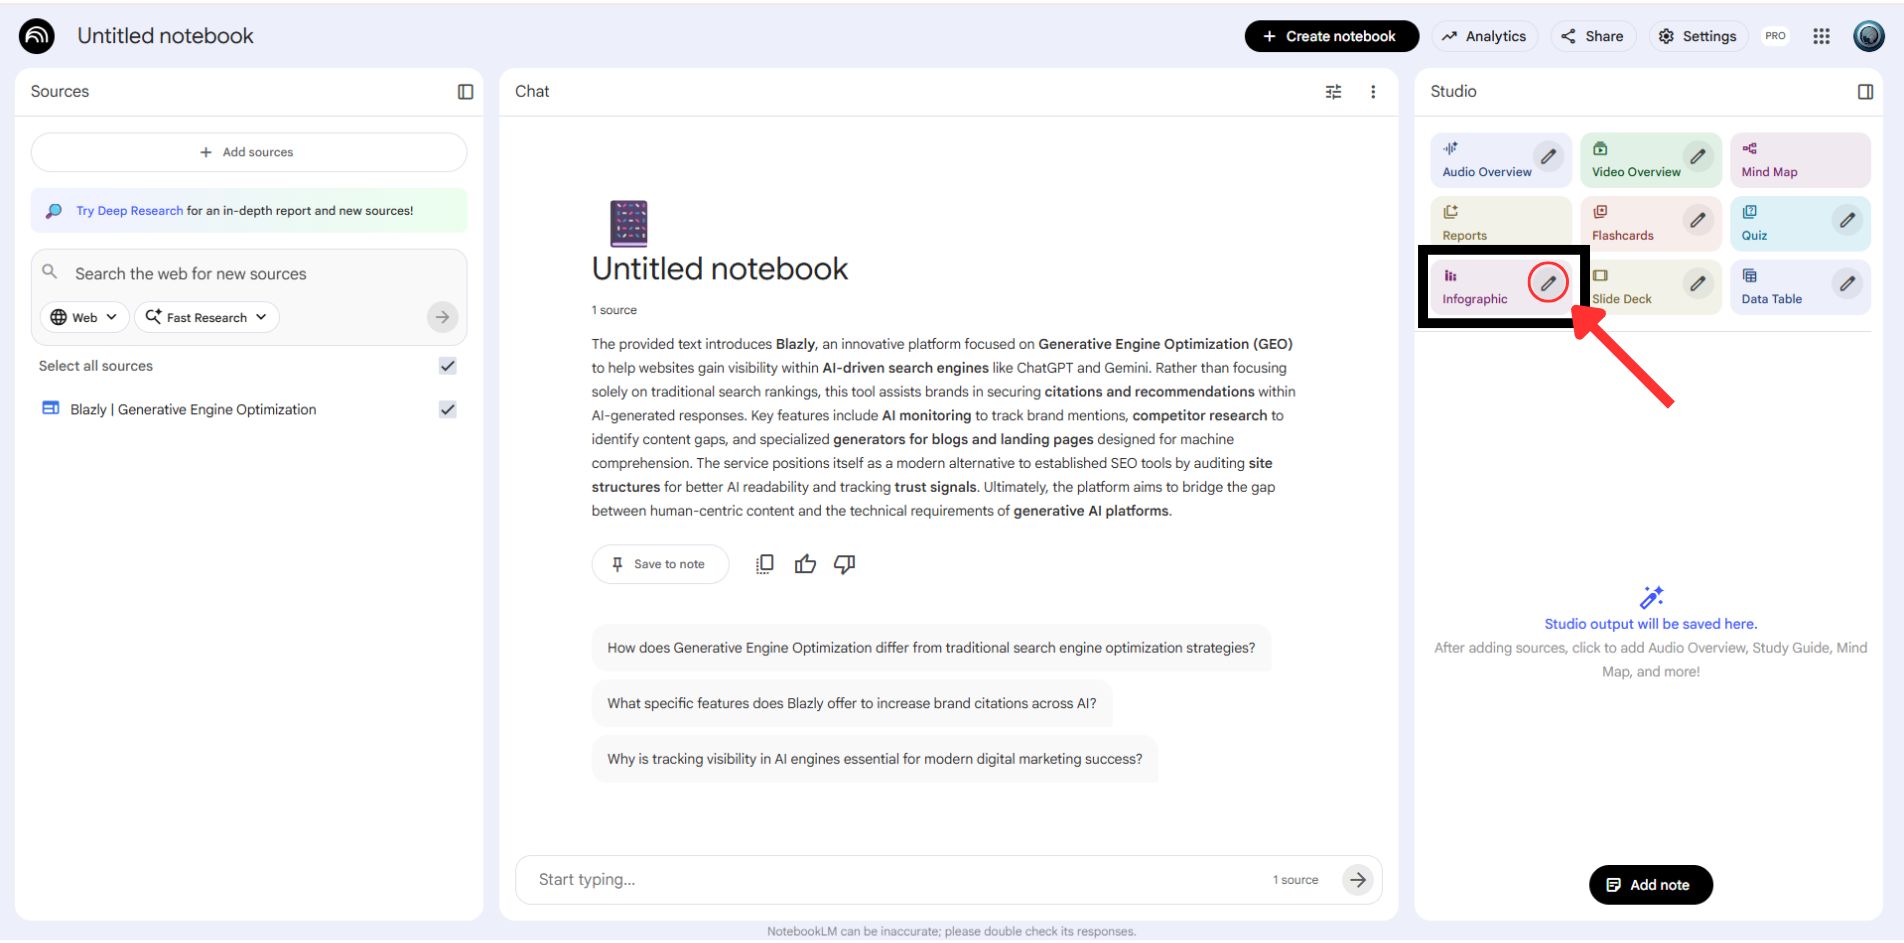
Here, you can tell NotebookLM exactly what to create:
how many key points to highlight
the tone (professional, educational, clean)
layout preferences
icons
and your brand colors
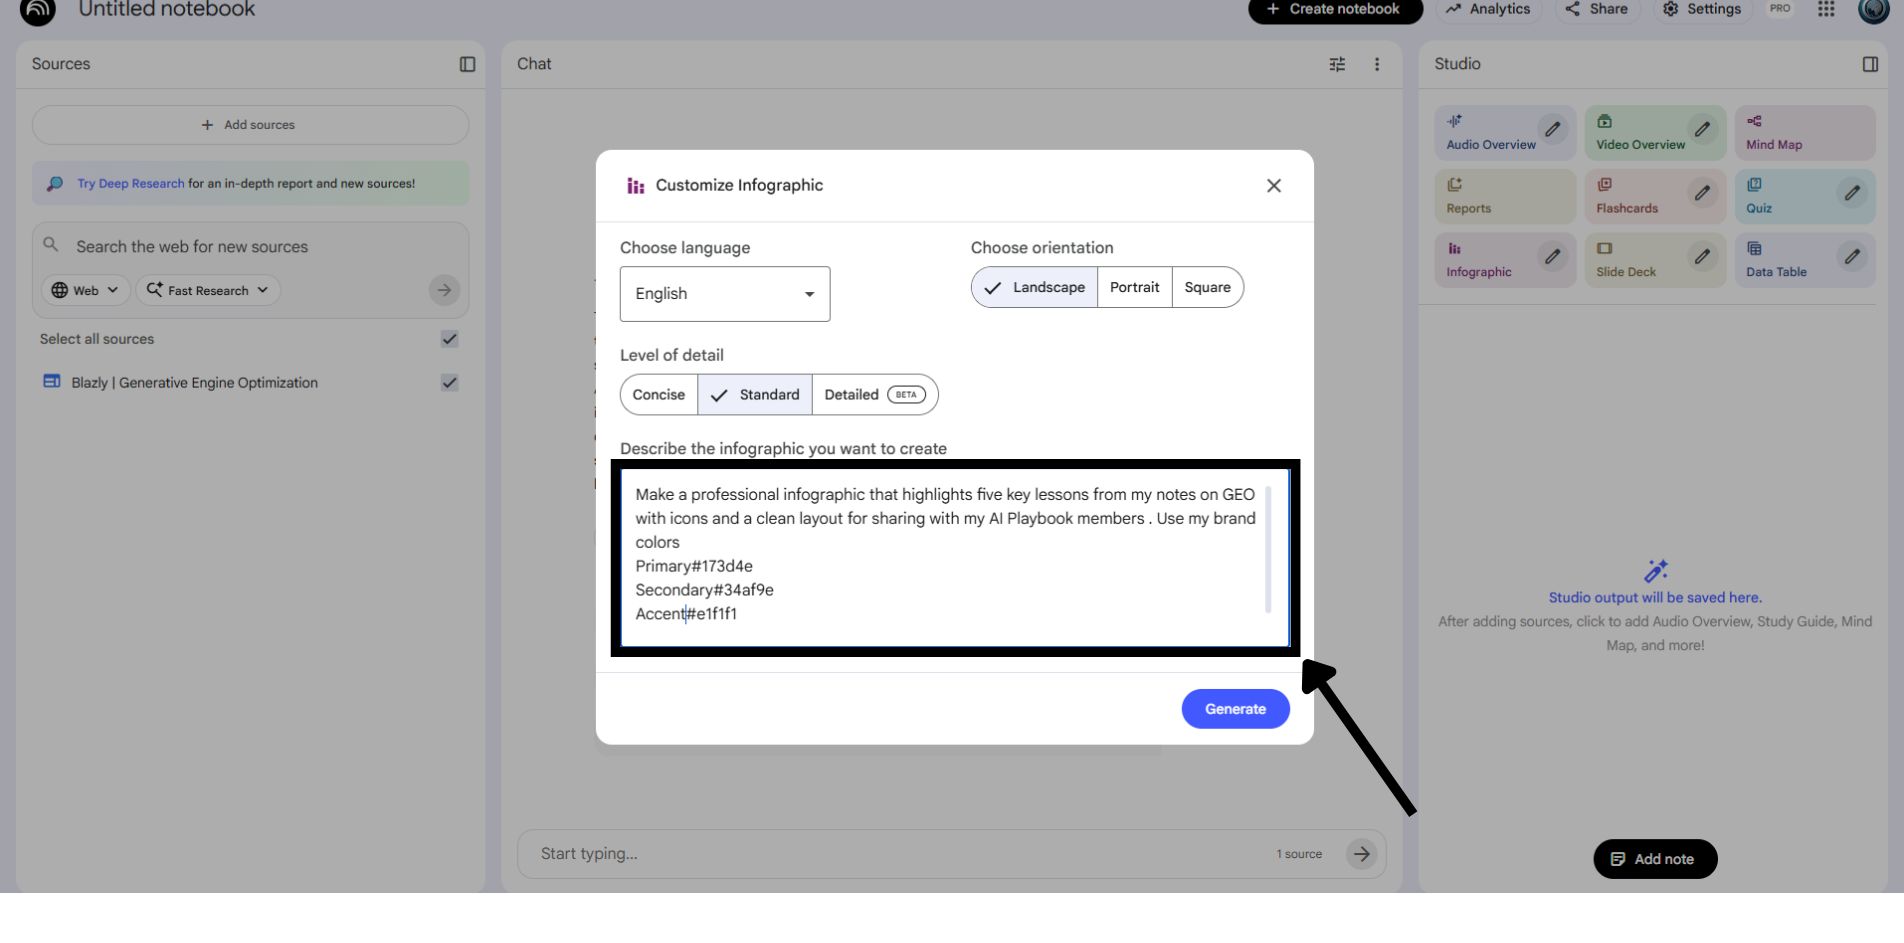
For example here’s the exact type of prompt I used for my files to generate the infographic:
Make a professional infographic that highlights five key lessons from my notes on GEO with icons and a clean layout for sharing with my AI Playbook members . Use my brand colors
Primary#173d4e
Secondary#34af9e
Accent#e1f1f1
The Result :
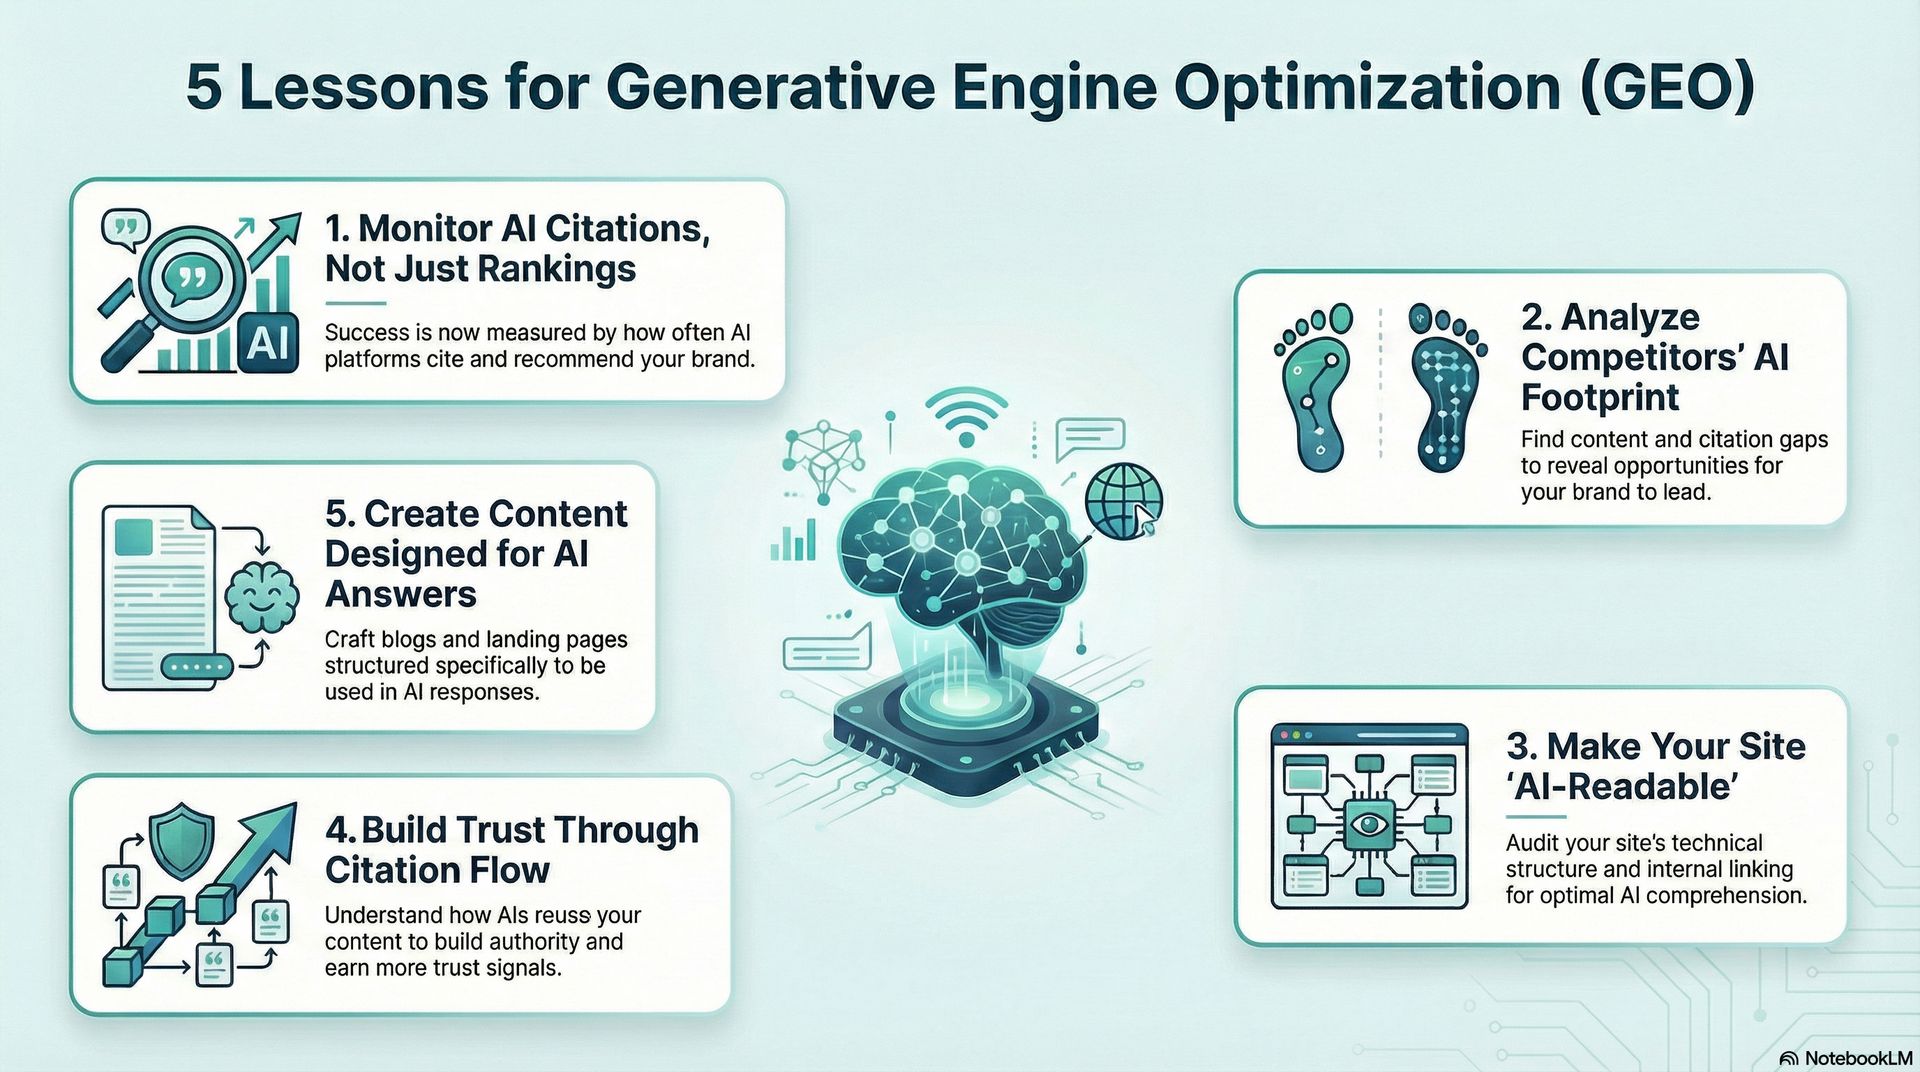
This is immediately usable as:
a client-facing asset
a lead magnet
a training resource
or a visual summary for complex topics
And it’s all created directly from your existing files — no design tools, no extra software, no manual formatting.
Deep Research with NotebookLM
If you don’t already have sources of your own, this is where NotebookLM becomes extremely powerful. Instead of collecting reports, articles, or PDFs manually, you can let NotebookLM generate high-quality sources for you and turn them into a structured research foundation.
Open NotebookLM and click Create new notebook and choose Web → Deep Research.
You can type any topic, and NotebookLM will automatically go out, find relevant sources, and compile everything into a research report you can actually use.
Example topic I used: Content marketing trends for the next 12–18 months.
Example Prompt:
Research content marketing trends for the next 12–18 months.

Focus on reputable sources such as Gartner, Forrester, McKinsey, HubSpot, Marketing AI Institute, industry publications, recognized practitioners, and major tech company blogs.

Include a mix of source types (reports, expert articles, case studies, and YouTube videos if relevant).

Prioritize sources from 2025–2026 so the findings reflect the latest trends, tools, and shifts.
Once it finishes, NotebookLM will generate a Deep Research Report and automatically list all the sources in your notebook. Now you have a complete source library without uploading anything yourself.
Now you can start using the research the smart way.
Instead of asking for a summary, ask NotebookLM to identify what you should be thinking about. In the chat box, ask a strategic question like this:
Based on these sources, what are the 5 most important questions a marketing leader should be asking about content strategy in 2026?
When the answer is useful, click Save to note. This keeps your best insights organized so you can reuse them later for planning, slides, or strategy docs.
Another powerful move here is running a gap analysis question.
At this stage, you’re no longer asking what the sources say you’re asking what’s missing.
Use a prompt like this:
What’s missing from these sources that would be critical for formulating a complete content strategy that rides on these trends?
NotebookLM will then evaluate the quality and coverage of your current sources, point out blind spots, and highlight important areas that deserve deeper research. This helps you avoid building strategies on incomplete information and surfaces angles you might not have considered on your own.
You can save this output as a note as well.
Do Fast Research Inside NotebookLM
Fast Research is used when you want to quickly gather relevant sources around a topic without running a full deep analysis. It’s perfect for exploring a space, validating interest, or collecting material you can immediately work with.
Start by creating a new notebook in NotebookLM. Select Web → Fast Research, then enter the topic you want to explore.
Now you can ask NotebookLM to find sources for almost any topic.
For this example, I used the following prompt:
Find reputable sources discussing AI adoption trends for online businesses in 2025 and 2026. Focus on trusted publications such as industry blogs, research reports, major tech companies, and well-known marketing platforms. Prioritize clear, practical insights over academic papers. After submitting the prompt, NotebookLM quickly scans the web and returns a curated list of sources.
You’ll see reports from places like HubSpot, Gartner, McKinsey, Microsoft, and other credible publishers.
Once the results appear, select the sources you want and import them into your notebook.
In the chat panel, you can ask follow-up questions based on the imported sources.
For example, after importing, I asked:
Example Prompt :
What are the most practical takeaways or recommendations mentioned across these sources?
Fast Research is best when you want speed, flexibility, and just enough structure to move forward while still keeping everything grounded in real, trustworthy sources.
3. Turn Your Research Into a Slide Deck
Once you’ve created your infographic, you can reuse the same research and notes to generate a full slide deck or create a new note
Inside your notebook, go to the Studio panel on the right and click Slide Deck.
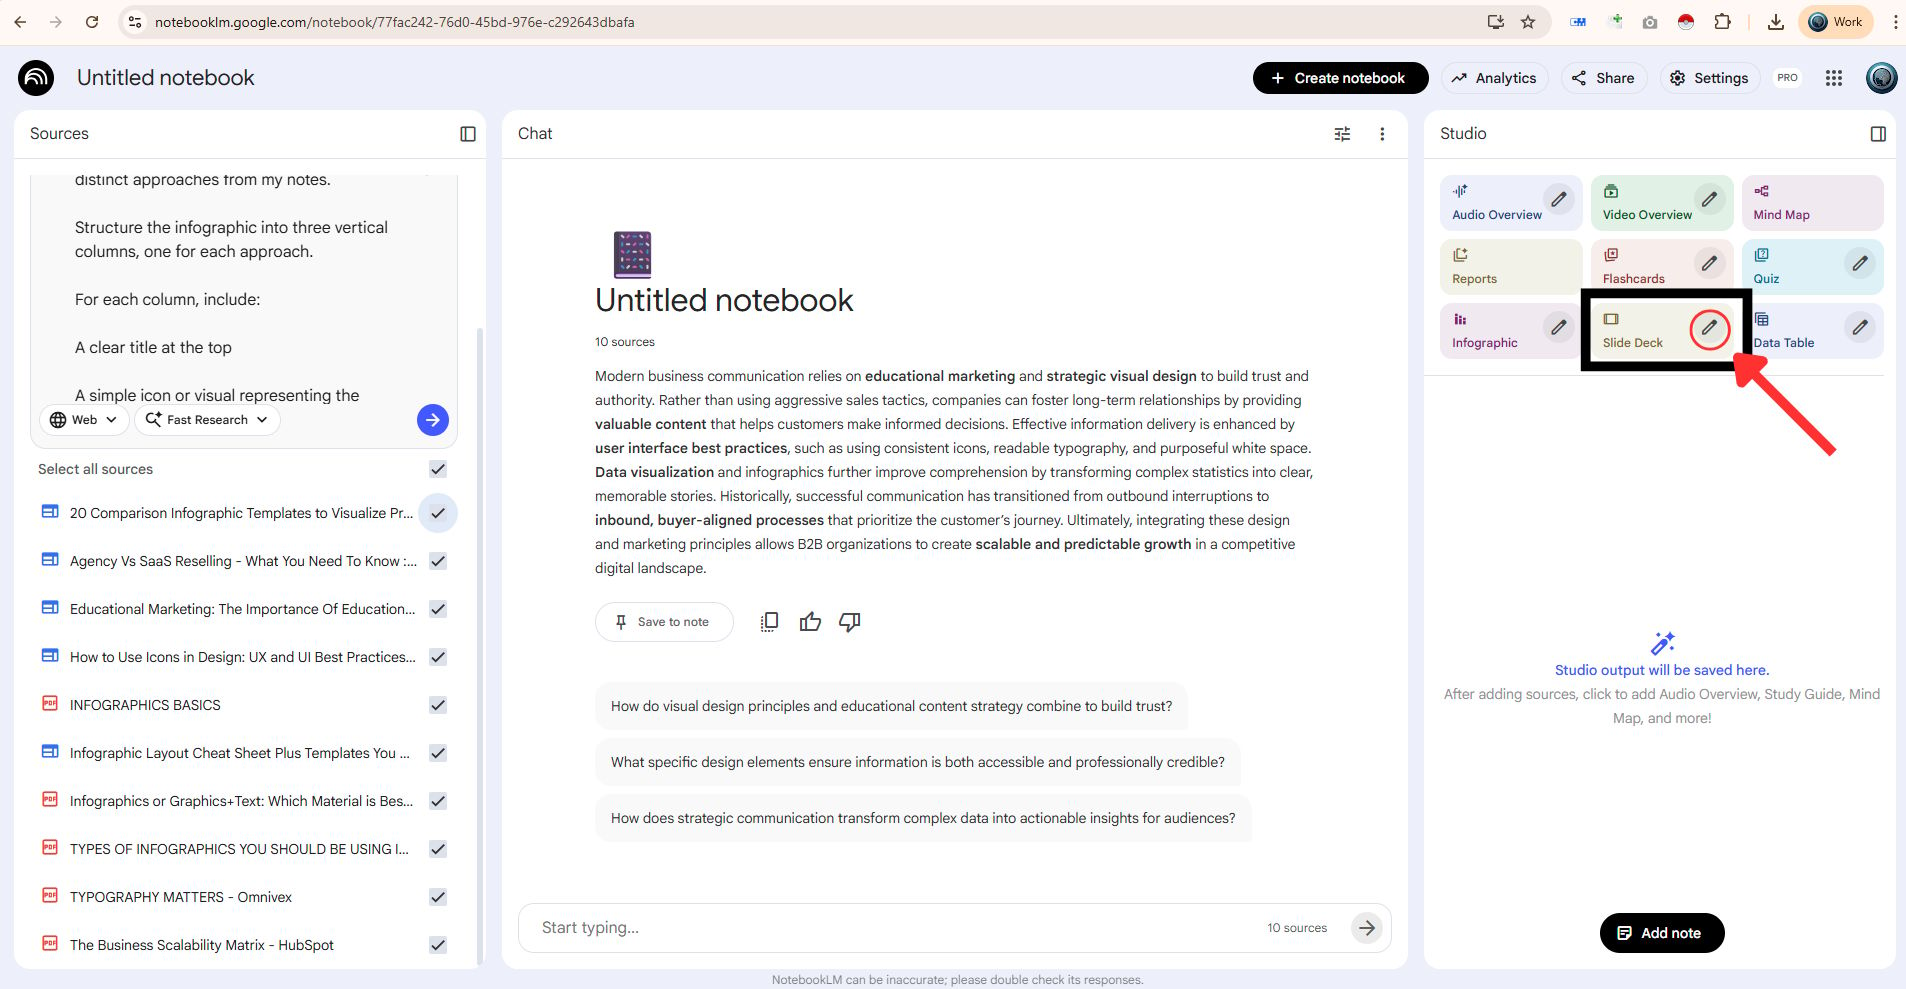
A customization window will open where you can choose:
Presenter Slides (recommended for clean, visual decks)
slide length
language
Now focus on the “Describe the slide deck you want to create” field this is where the quality of the output is decided.
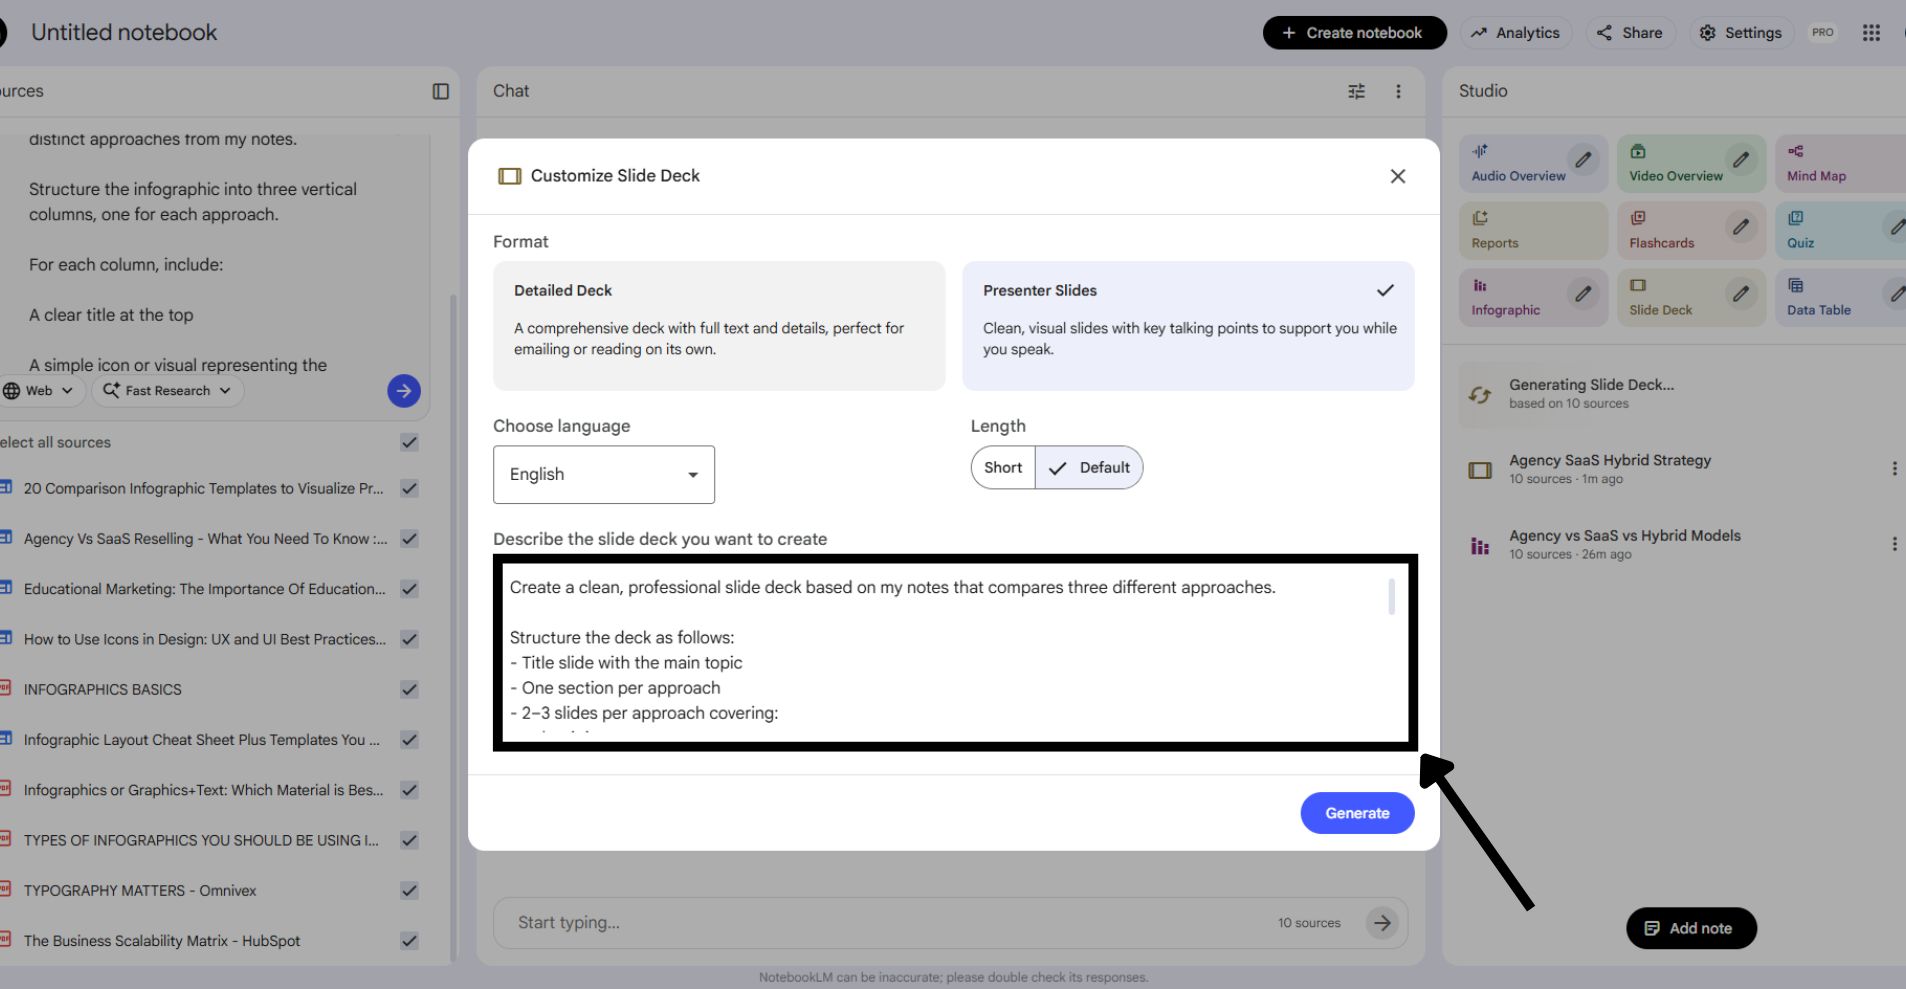
Here’s the Example prompt I used to generate the slide deck:
Create a clean, professional slide deck based on my notes that compares three different approaches.

Structure the deck as follows:
- A title slide introducing the topic
- One section per approach
- 2–3 slides per approach explaining:
  • what it is
  • how it works
  • key benefits
  • main trade-offs
- A final comparison slide that summarizes differences at a glance

Design guidelines:
- Visual-first slides with minimal text
- Use icons and simple visuals where helpful
- Clear headings and strong visual hierarchy
- Apply my brand colors
- Keep the deck presentation-ready

Tone: educational and business-focused
Audience: online business owners
The Result
NotebookLM creates a fully structured slide deck including layout, visuals, and flow directly from your research.
You now have:
an infographic
a slide deck
all built from the same source material
What normally takes hours of outlining, writing, and designing is done in minutes.
4. Turn Research Into a Mind Map
Using the same notebook and sources, go to the Studio panel on the right and click Mind Map.
NotebookLM will automatically analyze your research and generate a structured, visual map of the topic.
The Result
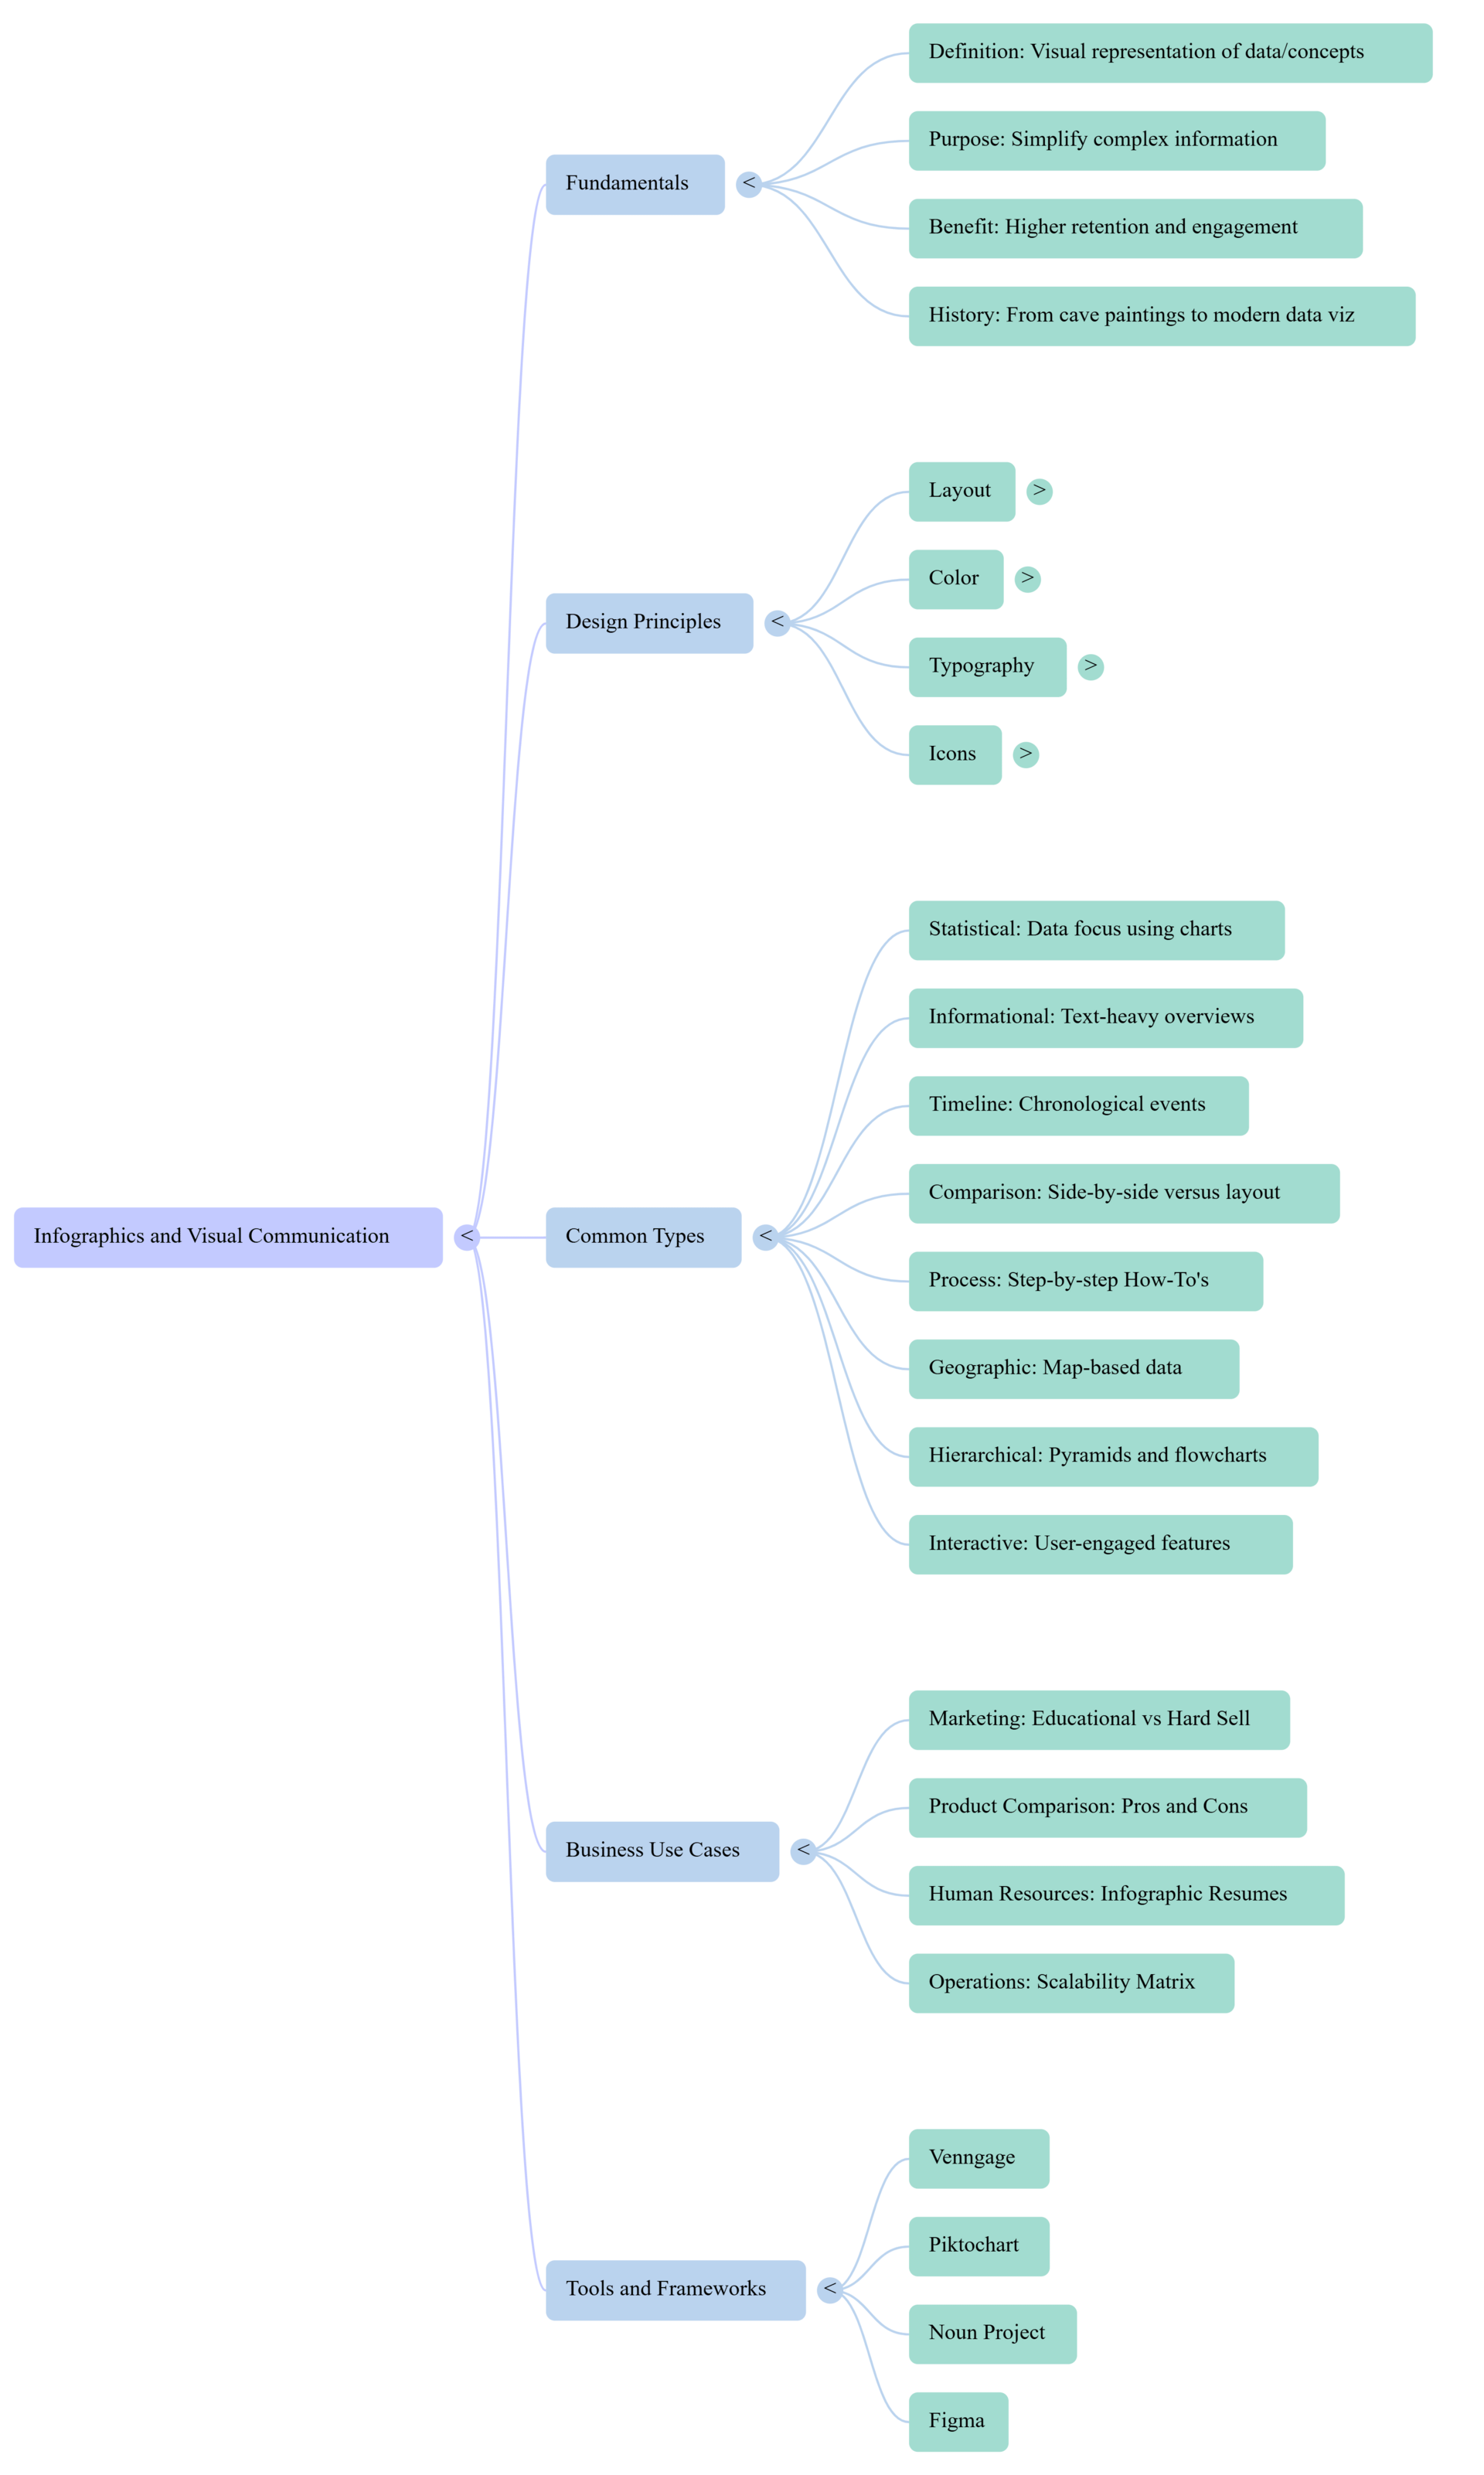
NotebookLM creates a clickable, expandable mind map that shows:
how ideas relate to each other
major categories at a glance
gaps and opportunities you might miss in linear notes
This is extremely useful for:
strategy planning
tool selection
roadmap creation
explaining complex topics to a team
Instead of scrolling through notes, you can see the whole system visually in one place.
5. Create Custom Explainer Videos From Your Notes
Now that you’ve turned your research into visuals, slides, and even interactive tools, you can also do is to turn the same content into a video explainer.
Inside your notebook, go to the Studio panel and click Video Overview.
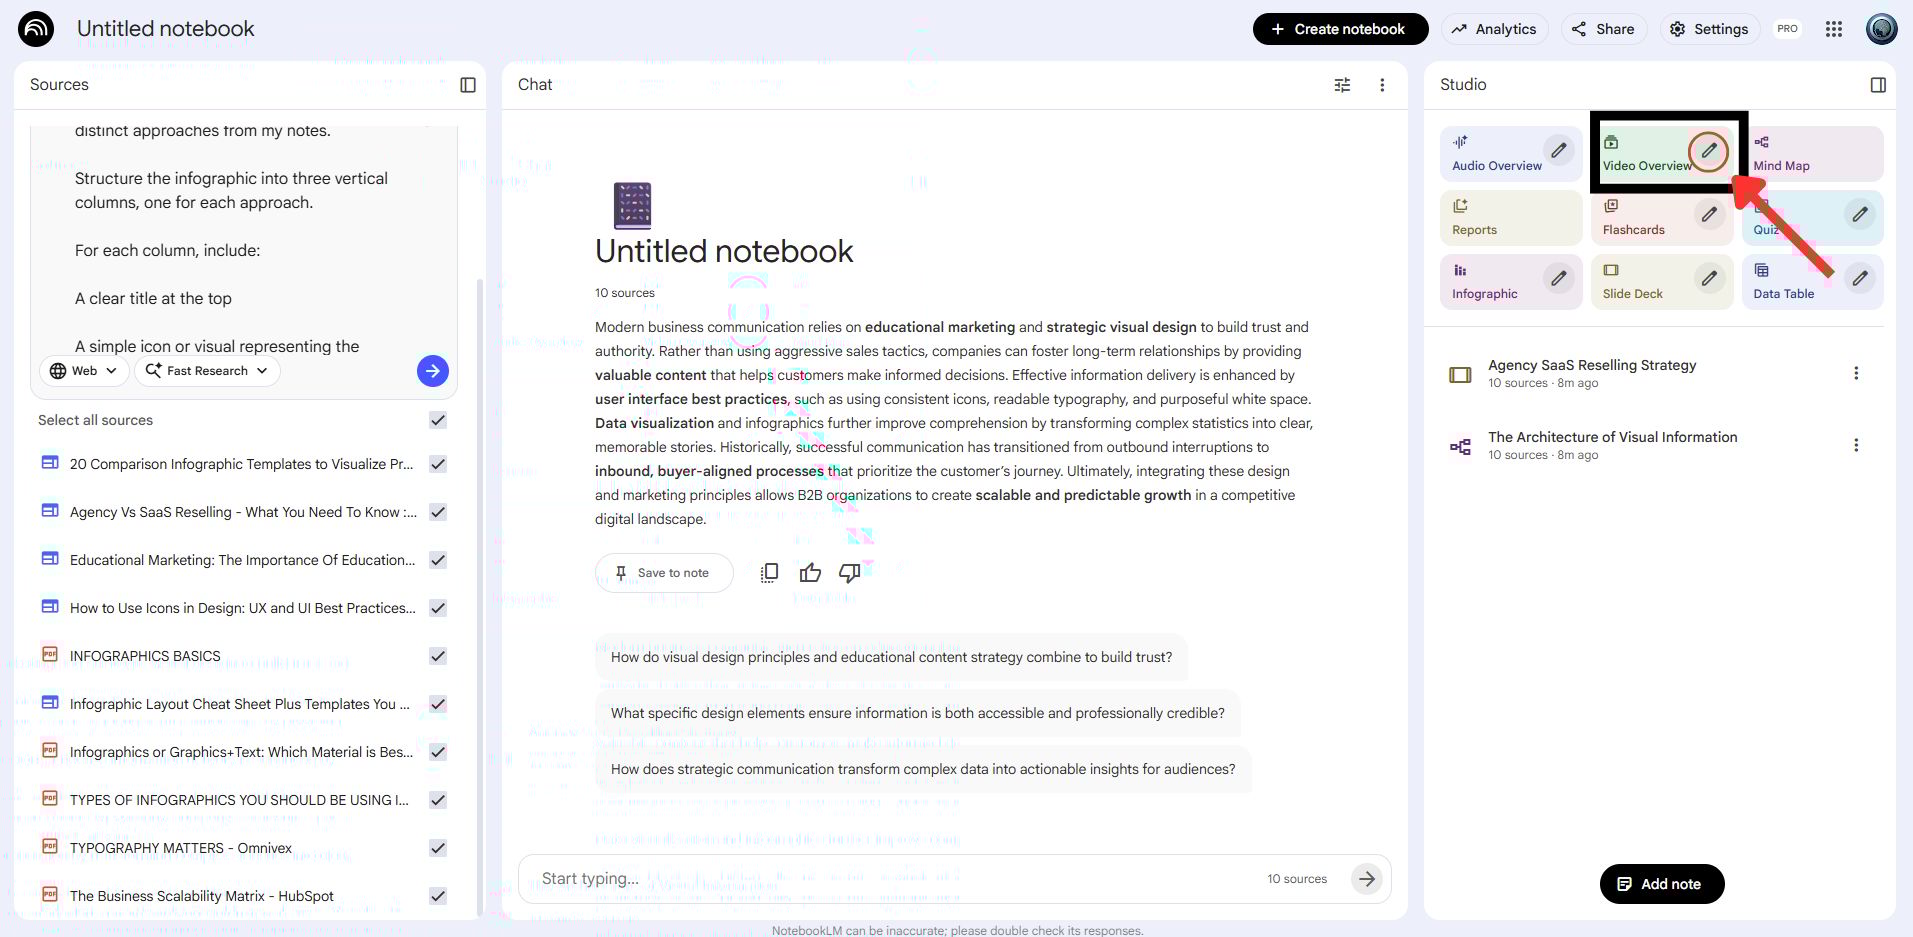
When the video settings open, you can:
choose a visual style (for example: anime, clean, minimal)
guide the focus of the video
apply brand colors if you want
This is where you tell NotebookLM what the video should explain and who it’s for.
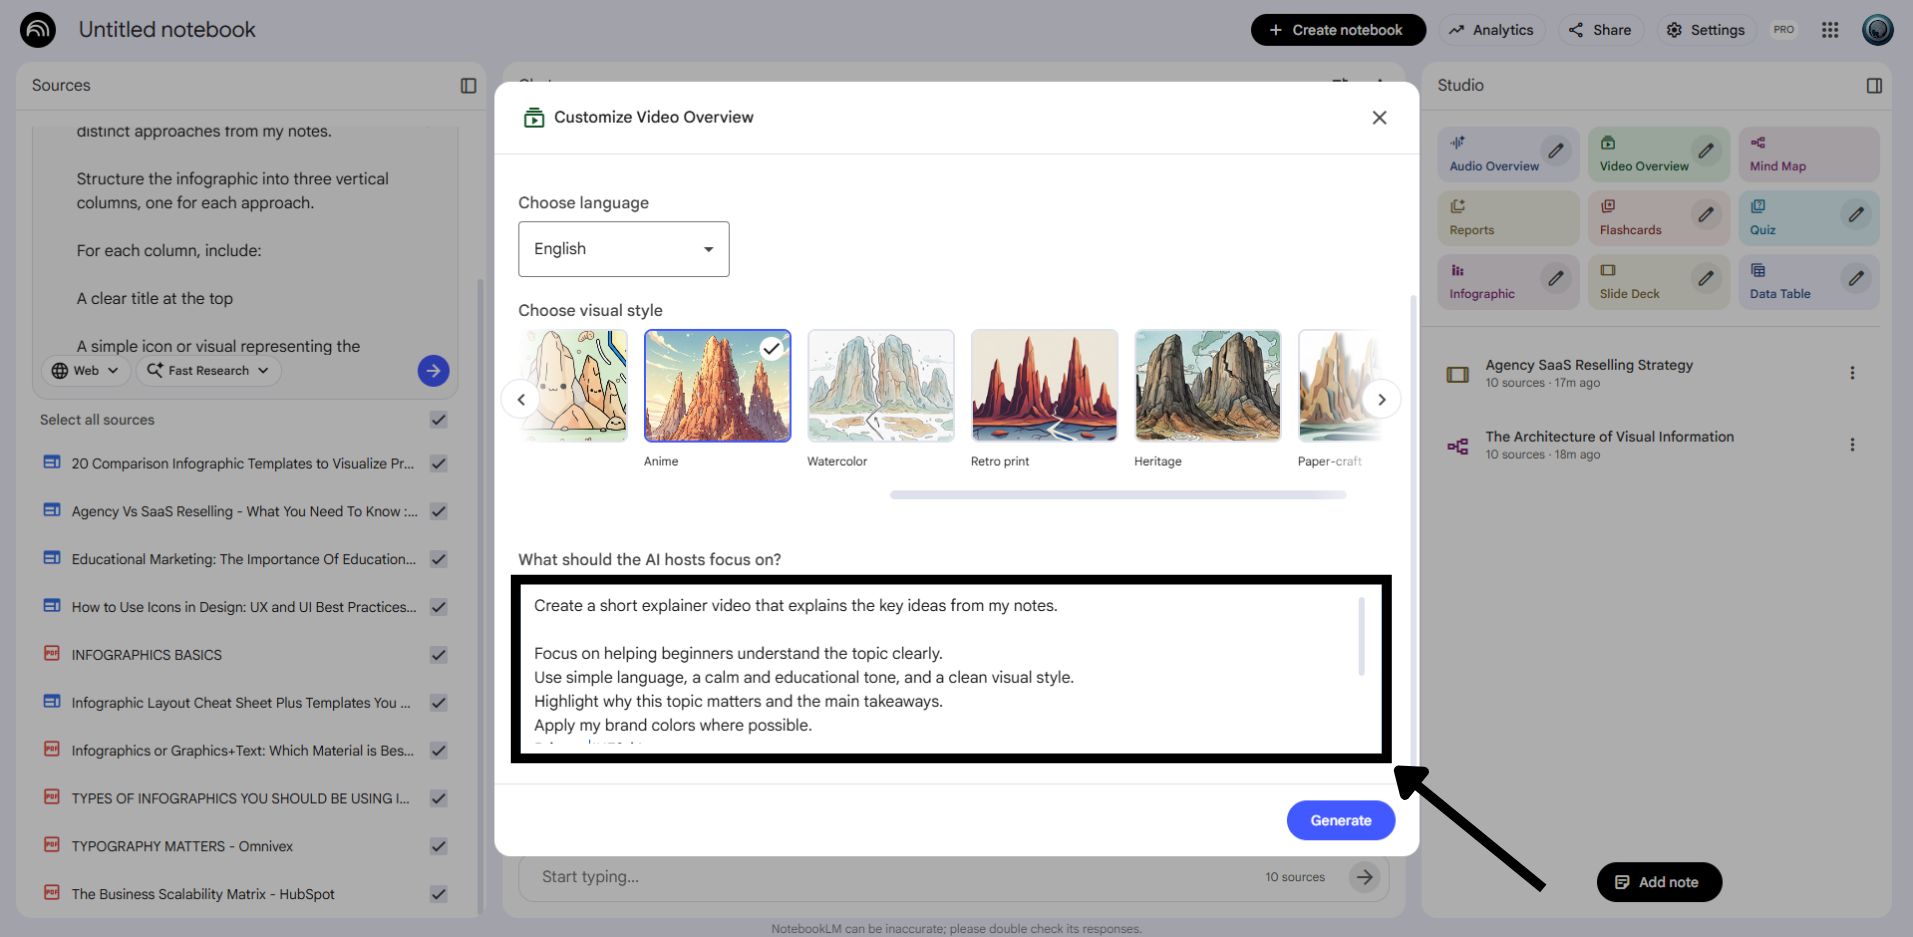
Here’s an example of the type of prompt I used:
Create a short explainer video that explains the key ideas from my notes.

Focus on helping beginners understand the topic clearly.
Use simple language, a calm and educational tone, and a clean visual style.
Highlight why this topic matters and the main takeaways.
Apply my brand colors where possible.
The Result
NotebookLM generates a fully narrated explainer video using your notes as the source.
You can:
download the video
share it with your audience
use it for onboarding, education, or content marketing
At this point, a single research pass has become:
an infographic
a slide deck
a mind map
an interactive tool
and a video explainer
All created from the same source material.
Final Thoughts
NotebookLM is not just another AI research tool. It is a complete thinking and content workspace.
For researchers, it replaces hours of reading and note taking by grounding insights directly in trusted sources, making synthesis faster and more reliable.
For students, it turns dense material into structured understanding, allowing them to learn faster, ask better questions, and retain information through notes, visuals, and audio.
For marketers, founders, and strategists, it removes the friction between research and execution, turning raw information into strategy, slides, infographics, and decision ready insights in one place.
For teams, it becomes a shared source of truth where research, documentation, and outputs stay organized and accessible.
By combining Deep Research for comprehensive analysis and Fast Research for quick discovery, NotebookLM adapts to how people actually work, whether starting from scratch or refining an idea mid workflow.
What makes it powerful is not just the AI, but the structure.
Sources stay grounded. Questions build on each other. Insights can be saved, reused, visualized, and shared.
The result is fewer tools, less context switching, and a much clearer path from information to action.
In short, NotebookLM does not just help you find answers. It helps you think better, work faster, and turn knowledge into something useful.
We’d love to hear from you!How did you feel about today's MonDive? Your feedback helps us improve and deliver the best possible content. |
Know someone who may be interested?
And that's a wrap on today's MonDive!
Reply